Netflix Analysis Dashboard
This project focuses on enhancing content recommendation and customer engagement strategies within Netflix's streaming platform. The following steps were taken to achieve this:
Problem Statement
How can Netflix leverage data to enhance its content strategy, optimize viewer engagement, and maintain its competitive edge in the global streaming market?
To address this question, it is crucial to analyze content distribution, viewer preferences, and release patterns. By utilizing a comprehensive dashboard, we can gain actionable insights into how Netflix’s content offerings align with viewer demands and market trends
A Data-Driven Dashboard Analysis with Tableau
Netflix has revolutionized the way we consume media, offering a vast library of content that caters to diverse tastes and preferences. To stay ahead in the highly competitive streaming industry, Netflix must continually adapt its content strategy based on data-driven insights. In this project, we'll explore how a carefully crafted dashboard can provide valuable information on Netflix's content strategy and its effectiveness in engaging viewers.
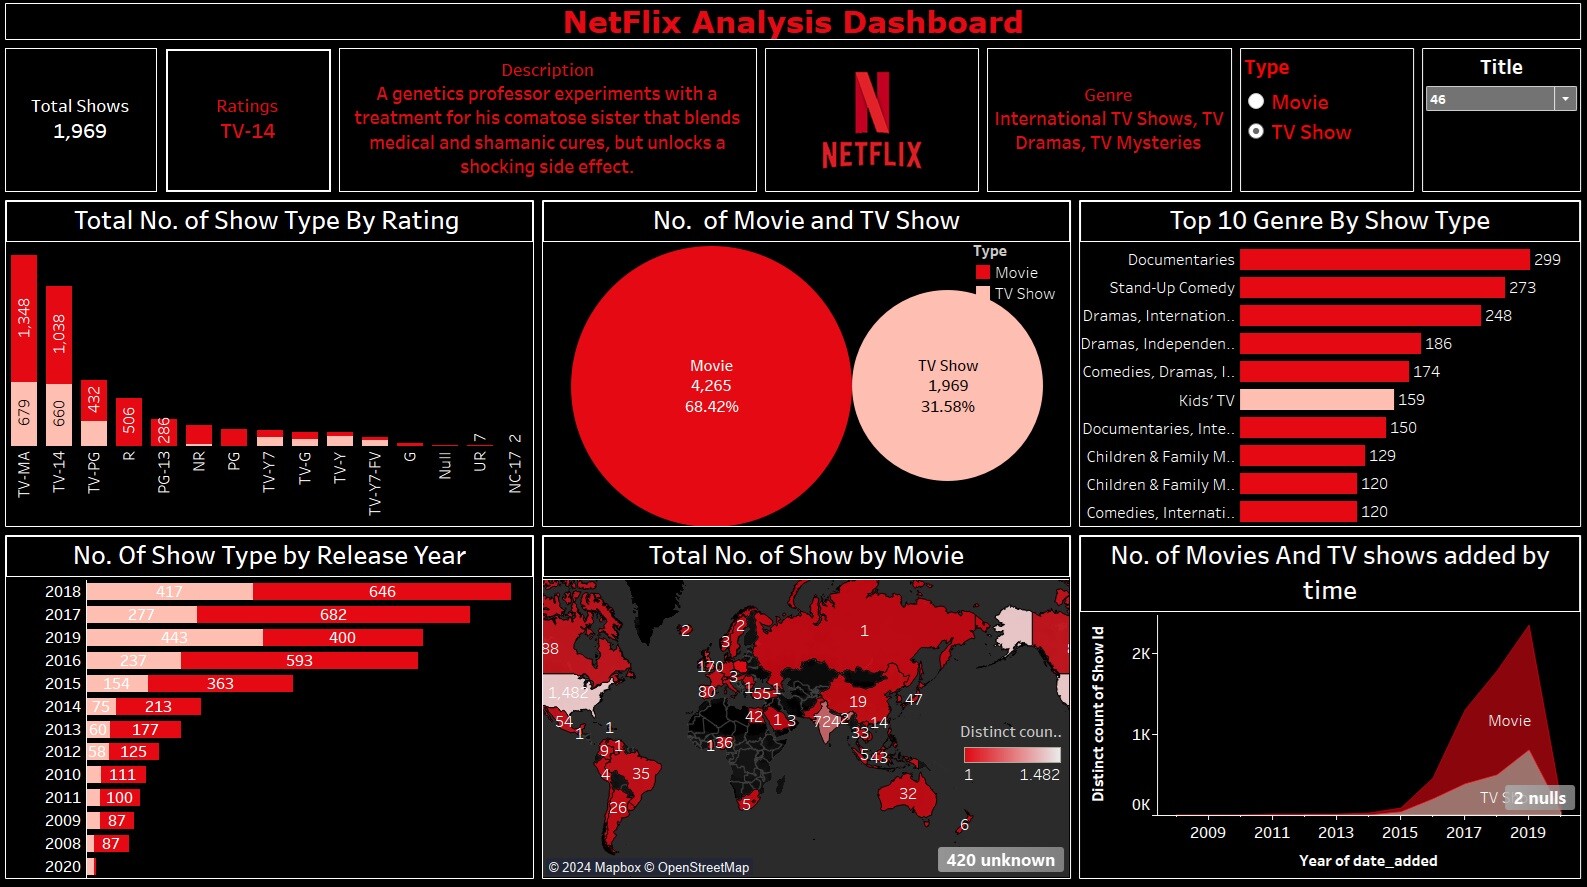
Key Metrics and Visualizations
-
Total Number of Show Types by Rating (Bar Chart) This chart provides a detailed view of how different show types—movies and TV shows—are distributed across various ratings. By understanding which types of content receive higher ratings, Netflix can focus on producing high-quality content that resonates with its audience.
-
Number of Movies and TV Shows (Bubble Chart) The bubble chart offers a snapshot of the volume of movies and TV shows available on Netflix. By visualizing this data, we can identify trends in content availability and assess whether the platform is meeting the diverse needs of its viewers.
-
Top 10 Genres by Show Type (Bar Chart) This visualization highlights the top 10 genres and breaks them down by show type. It reveals the most popular genres and how they are distributed across different types of content. This insight can guide Netflix in curating genre-specific content that aligns with viewer preferences.
-
Number of Show Types by Release Year (Bar Chart) Tracking the number of movies and TV shows released each year provides a clear view of Netflix's content production trends. This chart helps identify peak periods of content creation and can inform future content strategies.
-
Total Number of Shows by Region (World Map) The world map visualizes the geographic distribution of Netflix’s content. By showing where content is produced or available, this map underscores Netflix’s global reach and its commitment to offering diverse, region-specific content.
-
Number of Movies and TV Shows Added Over Time (Line Chart) The line chart tracks the growth in the number of movies and TV shows added to Netflix over time. This trend helps assess content expansion and identify periods of significant growth, providing a timeline of Netflix’s content evolution.
Insights and Strategic Recommendations
-
Content Quality and Ratings By analyzing ratings across different show types, Netflix can prioritize high-rated content and explore factors contributing to its success. This focus on quality can enhance viewer satisfaction and drive higher engagement.
-
Genre Preferences Understanding genre distribution allows Netflix to tailor its content library to match viewer interests. Emphasizing popular genres and exploring emerging trends can help attract and retain subscribers.
-
Geographic Expansion The world map highlights the effectiveness of Netflix’s global strategy. Expanding content production in diverse regions and catering to local preferences can strengthen Netflix’s position in international markets.
-
Content Production Trends Analyzing release patterns helps Netflix strategize content production and distribution. Aligning content releases with seasonal trends and global events ensures that Netflix remains relevant and timely.
-
Growth and Expansion The line chart reveals Netflix’s content expansion trajectory. By understanding growth patterns, Netflix can make informed decisions about future content investments and strategic initiatives.
Conclusion
Netflix's success in the streaming industry is driven by its ability to adapt and innovate based on data-driven insights. This dashboard analysis provides a comprehensive view of how Netflix’s content strategy aligns with viewer preferences and market trends. By leveraging these insights, Netflix can continue to enhance its content offerings, engage viewers, and maintain its competitive edge in the ever-evolving digital entertainment landscape.